Enhancing Learning and Decision-Making: Multi-Dimensional Assessments and Radar Charts in Education, Business, and Software Development

With a decade of experience in education journalism, Lauren Robinson leads The EduTimes with a sharp editorial eye and a passion for academic integrity. She specializes in higher education policy, admissions trends, and the evolving landscape of online learning. A firm believer in the power of data-driven reporting, she ensures that every story published is both insightful and impactful.
Input
Modified
Enhancing Critical Thinking Through Multi-Dimensional Queries
Multi-Dimensional Assessments - Kirkpatrick’s Model and Radar Charts
Broader Impact of Radar Charts and Multi-Dimensional Assessments

Educators rely on assessments to determine whether students have mastered course content, which is essential for measuring student learning outcomes. The depth of a student's comprehension is frequently not captured by traditional yes/no queries, despite their widespread use. Educators have responded to this challenge by implementing multi-dimensional assessment queries that necessitate students to exhibit their knowledge in multiple dimensions. In the same vein, radar charts are a highly effective instrument for visualizing multi-dimensional data, which is beneficial for software development, business, and education. Professionals from a variety of disciplines can guarantee optimized workflows, data-driven enhancements, and effective assessments by incorporating these tools.
Enhancing Critical Thinking Through Multi-Dimensional Queries
Multi-dimensional assessment queries require students to apply concepts, analyze relationships, and synthesize knowledge in a variety of ways, in addition to providing simple right/wrong answers. Rather than assessing rote memorization, these queries promote practical application and critical thinking. Multi-dimensional assessments guarantee that students comprehend the subject matter genuinely, in contrast to multiple-choice queries that may permit guessing. These questions necessitate students to apply, evaluate, and analyze their knowledge, thereby improving their cognitive abilities that are applicable beyond the classroom. Open-ended, thought-provoking queries foster engagement and enhance the interactive nature of the learning experience. Additionally, they foster a more thorough understanding of the subject matter, ensuring that students are able to implement and articulate their knowledge rather than merely recollecting facts.

Multi-Dimensional Assessments - Kirkpatrick’s Model and Radar Charts
Kirkpatrick's Model, a four-level evaluation framework, can be employed by educators to quantify the influence of multi-dimensional assessments. This model enables educators to determine the extent to which students employ their learning in real-world scenarios, measure student comprehension across multiple dimensions, gather student feedback on assessment methods, and evaluate the overall impact of these assessments on academic performance. It is imperative to establish clear learning objectives, integrate various cognitive levels using Bloom's Taxonomy, design questions that apply concepts to real-world scenarios, provide clear instructions, and pilot test questions for refinement in order to guarantee the efficacy of multi-dimensional assessment questions. These procedures facilitate the development of assessments that are both rigorous and user-friendly, thereby providing valuable insights into the progress of student learning.
Enhancing Critical Thinking Through Multi-Dimensional Queries
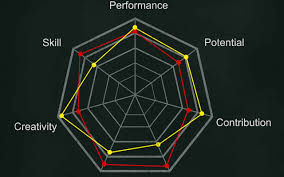
Radar charts, which are also referred to as spider charts, are two-dimensional graphical tools that facilitate the visual comparison of numerous quantitative variables. These visualizations are especially beneficial for the purpose of comparing multiple data sets and identifying trends, outliers, and overlaps. The chart emphasizes strengths, limitations, and patterns across categories, with each axis representing a distinct variable. Radar charts facilitate the simultaneous visualization of multiple groups of data, thereby simplifying the assessment of the performance of various variables in relation to one another. Their shape rapidly identifies areas of high and low performance and enables the simple identification of anomalies or trends that may not be immediately apparent in traditional tabular data. Radar charts' adaptability allows for their application in a variety of disciplines, including corporate decision-making and education, to effectively present complex data in an intuitive format.
Radar schematics are not without their drawbacks, regardless of their utility. Determining an ultimate "winner" can be difficult when certain variables receive higher scores than others. The ability to differentiate between values that are near may be impeded by the obscuration of subtle differences caused by overlapping lines. Furthermore, radar charts are not suitable for large data sets due to the complexity of interpretation caused by the abundance of variables. Nevertheless, they continue to be beneficial for project evaluations, decision-making processes, and competitive analysis. For instance, a radar chart was implemented by a software development team to evaluate potential enhancements to a product. They identified critical areas for enhancement and utilized additional customer feedback to make a well-informed final decision by scoring a variety of options across multiple attributes. A distinct visual framework for comparative analysis is provided by radar charts in these applications, which emphasize their capacity to improve strategic planning.
Software refactoring is the process of reorganizing existing code to enhance readability, maintainability, and efficacy without modifying its external behavior. Nevertheless, it can be challenging to ascertain which components of the code necessitate refactoring. Software developers utilize radar charts to visually evaluate a variety of software components by plotting critical metrics, including code complexity, code odors, and dependency levels. Teams can effectively prioritize refactoring efforts by analyzing these dimensions. In a real-world software project, a study utilized radar charts to assist developers in identifying problematic areas that deviated from coding standards, comparing various software components to determine which required the most attention, and optimizing decision-making by integrating radar charts with other visualization tools such as heat maps. This integration of visualization tools enables developers to proactively resolve potential weaknesses, providing a multifaceted approach to software quality control.
Although conventional techniques such as heat maps and tree maps are beneficial, radar charts provide a comprehensive understanding of software complexity, more intuitive pattern recognition, and a more accurate comparison of multiple code attributes at once. In order to effectively implement radar charts in software development, teams must select pertinent metrics that accurately reflect code quality, establish threshold values to identify outliers, and automate the generation of radar charts to perpetually monitor code quality in real time. The incorporation of radar charts into software development workflows enhances the monitoring of code quality and the development of refactoring strategies. These charts assist teams in making more informed and efficient decisions by offering a visual representation of code health. The utilization of these visualization tools guarantees that refactoring decisions are data-driven, thereby minimizing the need for superfluous code modifications and upholding the highest standards of reliability and efficiency.
Broader Impact of Radar Charts and Multi-Dimensional Assessments
The incorporation of radar charts and multi-dimensional assessment queries into data analysis and education offers valuable insights into software development, performance metrics, and learning outcomes. Radar chart visualization provides businesses and developers with superior decision-making tools, while educators experience enhanced assessment accuracy and student engagement. Professionals in a variety of disciplines can guarantee effective assessments, data-driven improvements, and optimized workflows by utilizing these sophisticated tools, which will ultimately result in improved learning and operational outcomes. These methodologies underscore the significance of utilizing analytical and visualization tools to improve problem-solving capabilities, thereby cultivating a culture of continuous innovation and improvement.
With a decade of experience in education journalism, Lauren Robinson leads The EduTimes with a sharp editorial eye and a passion for academic integrity. She specializes in higher education policy, admissions trends, and the evolving landscape of online learning. A firm believer in the power of data-driven reporting, she ensures that every story published is both insightful and impactful.
Similar Post